

Question: Figure 3.19 shows the final classification tree for the case study. For each of the following new sales leads (predictor records), read down this classification
Figure 3.19 shows the final classification tree for the case study. For each of the following new sales leads (predictor records), read down this classification tree to obtain the prediction about whether or not this new sales lead will have solar installed. Also identify the path followed down the tree.
a. A new sales lead that has an annual household income of $250,000 and a rooftop that has 3.5 peak sun hours.
b. A new sales lead that has an annual household income of $100,000 and a rooftop that has 5.5 peak sun hours.
c. A new sales lead that has an annual household income of $150,000 and a rooftop that has 2.3 peak sun hours.
Data from FIGURE 3.19
The final classification tree for the case study, where splits are not allowed if they result in a region with only a single record.
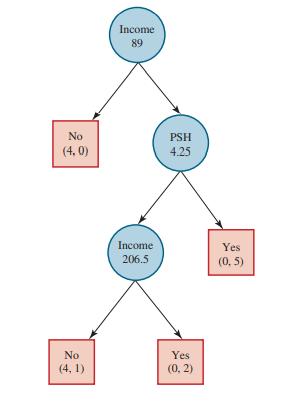
No (4.0) No (4,1) Income 89 Income 206.5 PSH 4.25 Yes (0, 2) Yes (0,5)
Step by Step Solution
3.42 Rating (171 Votes )
There are 3 Steps involved in it
a Rightleftright Predict yes on ... View full answer

Get step-by-step solutions from verified subject matter experts