

Figures 3.16 and 3.17 show the second and third splitting of the data into regions when applying
Question:
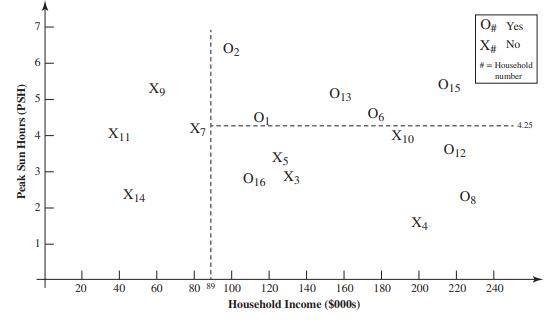
Figures 3.16 and 3.17 show the second and third splitting of the data into regions when applying the classification tree algorithm to the case study.
a. Calculate the values of the Gini Index for each of the two new regions created by the second split, as well as the Overall Gini Index and the improvement in the overall homogeneity.
b. Repeat part a for the two new regions created by the third split.
Data from FIGURE 3.16
The second split of the data, splitting the right region (household income > $89 thousand) into two new regions—those with peak sun hours ≤ 4.25 and those with peak sun hours > 4.25—for the case study.
Fantastic news! We've Found the answer you've been seeking!
Step by Step Answer:
a Gini Index top 1 05 2 55 2 0 Gini Index bottom 1 47 2 37 2 0490 Overall Gini ...View the full answer

Answered By
Rajiv Chadha
I m in field of education from last 7 years , teaching science upto high level schooling and taking chemistry as specialized subject at senior level. I m associated with neetprep which is online platform for medical entrance in india.i try to clear and teach basic concepts of chemistry and also teaches students short- cuts for problem solving so that they can develop interest in subject and acquire good knowledge as well as good grades. I like to pass whatever I ve learnt academically to younger generation so that they take further human race to better standards.
0 Reviews
10+ Question Solved
Related Book For 

Introduction To Management Science and Business Analytics A Modeling And Case Studies Approach With Spreadsheets
ISBN: 9781260716290
7th Edition
Authors: Frederick S. Hillier, Mark S. Hillier
Question Posted:
