

Question: Using the FRED economic database (https:// fred.stlouisfed.org/), lets compare expenditures on cell phones with the price of phones. Unfortunately, as is often the case, its
Using the FRED economic database (https://
fred.stlouisfed.org/), let’s compare expenditures on cell phones with the price of phones. Unfortunately, as is often the case, it’s difficult to find the exact data we want, but if you search for
“real expenditures telephone,” you will find a series of expenditure on telephone and facsimile equipment (faxes—maybe you have heard of them?). Then click Edit Graph and Add Line.
When you search for “expenditures telephone price,” you should find a price series (make sure it says price index) for telephones and facsimile equipment. To make comparisons easier, change the units to Index and set the index equal to 100 around 2001 for both series and graph the data starting around 2000. Print the graph.
a. Between 2001 and 2015, what happened to expenditures? Prices?
b. Is the demand for telephones elastic or inelastic?
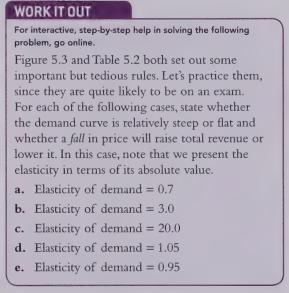
WORK IT OUT For interactive, step-by-step help in solving the following problem, go online. Figure 5.3 and Table 5.2 both set out some important but tedious rules. Let's practice them, since they are quite likely to be on an exam. For each of the following cases, state whether the demand curve is relatively steep or flat and whether a fall in price will raise total revenue or lower it. In this case, note that we present the elasticity in terms of its absolute value. a. Elasticity of demand = 0.7 b. Elasticity of demand = 3.0 c. Elasticity of demand = 20.0 d. Elasticity of demand = 1.05 e. Elasticity of demand = 0.95
Step by Step Solution
There are 3 Steps involved in it

Get step-by-step solutions from verified subject matter experts