

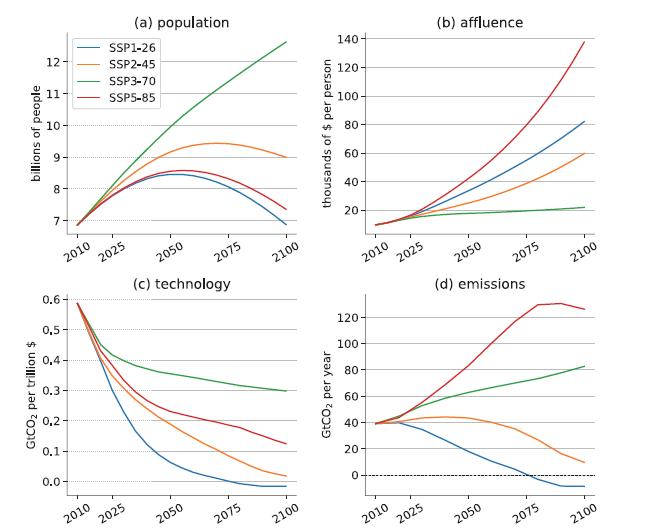
Figure 8.2 showed growth of the drivers of emissions under the various SSPs. For the low-growth SSP3,
Question:
Figure 8.2 showed growth of the drivers of emissions under the various SSPs. For the low-growth SSP3, the affluence term increases from about $10,000 per person to $22,000 per person between 2010 and 2100. For the high-growth SSP5 scenario, it increases from $10,000 per person to $138,000 per person. Estimate the rate of growth of affluence (percent per year) in these two scenarios.
Figure 8.2
Fantastic news! We've Found the answer you've been seeking!
Step by Step Answer:
SSP3 0...View the full answer

Answered By
Mugdha Sisodiya
My self Mugdha Sisodiya from Chhattisgarh India. I have completed my Bachelors degree in 2015 and My Master in Commerce degree in 2016. I am having expertise in Management, Cost and Finance Accounts. Further I have completed my Chartered Accountant and working as a Professional.
Since 2012 I am providing home tutions.
2+ Reviews
10+ Question Solved
Related Book For 
Question Posted:
