

Practice reading a graph. These questions all refer to Figure 1.1. (a) What fraction of days have
Question:
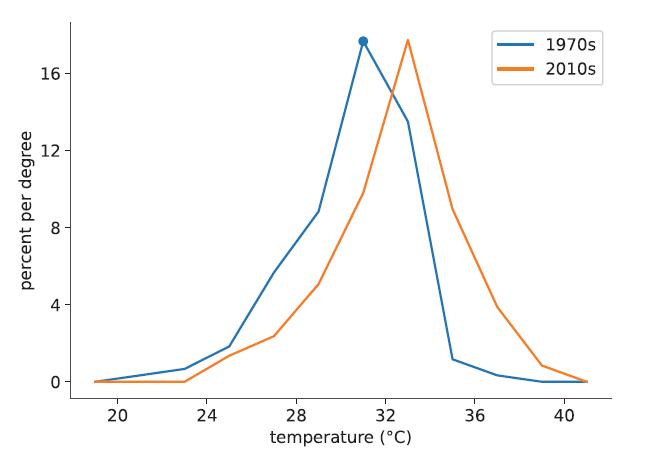
Practice reading a graph. These questions all refer to Figure 1.1.
(a) What fraction of days have a daily high temperature of 28°C during the 1970s and the 2010s?
(b) For the 1970s and 2010s, what is the most likely temperature? How much did it increase over this period?
(c) What temperature(s) have an equal probability of occurring in the two periods?
(d) For the 1970s and 2010s, estimate the fraction of days that have a temperature 35°C or greater.
(e) What does this tell you about the changes in extreme heat under even modest warming?
Figure 1.1
Fantastic news! We've Found the answer you've been seeking!
Step by Step Answer:
a 7 and 4 b 31C and 33C an increase of 2C c 32C d approximate the integrals as triangles For th...View the full answer

Answered By
Navashree Ghosh
I believe in quality work and customer satisfaction. So, I can assure you that you will get quality work from me when you hire me. Let's work together and build a long-term association.
82+ Reviews
116+ Question Solved
Related Book For 
Question Posted:
