

Question: 1. Plot the data and sketch what you consider to be the best-fitting linear, quadratic, and cubic models. The case study in Chapter 12 examined
1. Plot the data and sketch what you consider to be the best-fitting linear, quadratic, and cubic models.
The case study in Chapter 12 examined the effects of government regulation on for- eign ownership of assets in Canada. For example, the Foreign Investment Review Agency was created in 1975 to monitor and regulate foreign takeovers in Canada. In 1985, after a change of government, the Foreign Investment Review Agency was replaced with a new agency, Investment Canada, whose mandate was intended to be less restrictive. Did this change have any effect? The data in the table represent the percentage of commercial assets in non-financial corporations under foreign control (y) for the years 1975-2004. To simplify the analysis, we have coded the year using the coded variable x = year 1975. By examining a scatterplot of the data, you will find that the percentage of foreign ownership of Canadian assets does not appear to follow a linear relationship over time, but rather exhibits a curvilinear response. The question, then, is to decide whether a second-, third-, or higher-order model adequately describes the data."
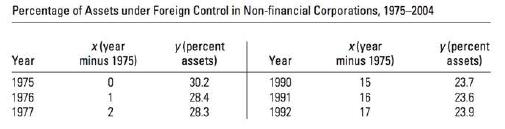
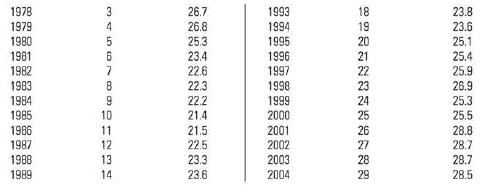
Percentage of Assets under Foreign Control in Non-financial Corporations, 1975-2004 x (year y(percent Year minus 1975) assets) Year x(year minus 1975) y (percent assets) 1975 0 30.2 1990 15 23.7 1976 1977 12 28.4 1991 16 23.6 28.3 1992 17 23.9
Step by Step Solution
There are 3 Steps involved in it

Get step-by-step solutions from verified subject matter experts