

Question: 10.26 Tuna Fish, again In Exercise 10.6 we presented data on the estimated average price for a 170 g can or a 200 g pouch
10.26 Tuna Fish, again In Exercise 10.6 we presented data on the estimated average price for a 170 g can or a 200 g pouch of tuna, based on prices paid nationally in supermarkets. A portion of the data is reproduced in the table below. Use the MINITAB printout to answer the questions.
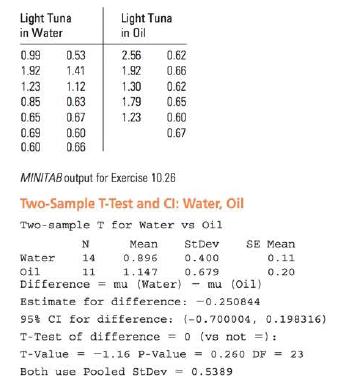
a. Do the data in the table present sufficient evidence to indicate a difference in the average prices of light tuna in water versus oil? Test using a = 0.05.
b. What is the p-value for the test?
c. The MINITAB analysis uses the pooled estimate of 2. Is the assumption of equal variances reasonable? Why or why not?
Light Tuna in Water Light Tuna in Oil 0.99 0.53 2.56 0.62 1.92 1.41 1.92 0.66 1.23 1.12 1.30 0.62 0.85 0.63 1.79 0.65 0.65 0.67 1.23 0.60 0.69 0.60 0.67 0.60 0.66 MINITAB output for Exercise 10.26 Two-Sample T-Test and Cl: Water, Oil Two-sample T for Water vs Oil N Mean StDev SE Mean Water 14 0.896 0.400 0.11 oil 11 1.147 0.679 0.20 Difference =mu (Water) - mu (Oil) Estimate for difference: -0.250844 95% CI for difference: (-0.700004, 0.198316) T-Test of difference = 0 (vs not =): T-Value = -1.16 P-value = 0.260 DF = 23 Both use Pooled StDev = 0.5389
Step by Step Solution
There are 3 Steps involved in it

Get step-by-step solutions from verified subject matter experts