

Question: 1.10 Basic Statistics Fifty people are grouped into four categories A, B, C, and D-and the number of people who fall into each category is
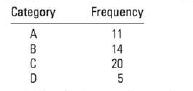
1.10 Basic Statistics Fifty people are grouped into four categories A, B, C, and D-and the number of people who fall into each category is shown in the table:
a. What is the experimental unit?
b. What is the variable being measured? Is it qualitative or quantitative?
c. Construct a pie chart to describe the data.
d. Construct a bar chart to describe the data.
e. Does the shape of the bar chart in part d change depending on the order of presentation of the four categories? Is the order of presentation important?
f. What proportion of the people are in category B, C, or D? g. What percentage of the people are not in category B?
Category Frequency A 11 B 14 C 20 D 5
Step by Step Solution
There are 3 Steps involved in it

Get step-by-step solutions from verified subject matter experts