

Question: 3.3 Consumer Spending The table below shows the average amounts spent per week by men and women in each of four spending categories: a. What
3.3 Consumer Spending The table below shows the average amounts spent per week by men and women in each of four spending categories:
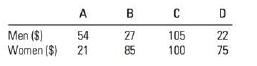
a. What possible graphical methods could you use to compare the spending patterns of women and men?
b. Choose two different methods of graphing and display the data in graphical form.
c. What can you say about the similarities or differ- ences in the spending patterns for men and women?
d. Which of the two methods used in part b provides a better descriptive graph?
A B C D Men ($) Women ($) 54 27 105 21 85 100 22 22 75
Step by Step Solution
There are 3 Steps involved in it
1 Expert Approved Answer
Step: 1 Unlock

Question Has Been Solved by an Expert!
Get step-by-step solutions from verified subject matter experts
Step: 2 Unlock
Step: 3 Unlock