

A Canadian manufacturer identified a critical diameter on a crank bore that needed to be maintained within
Question:
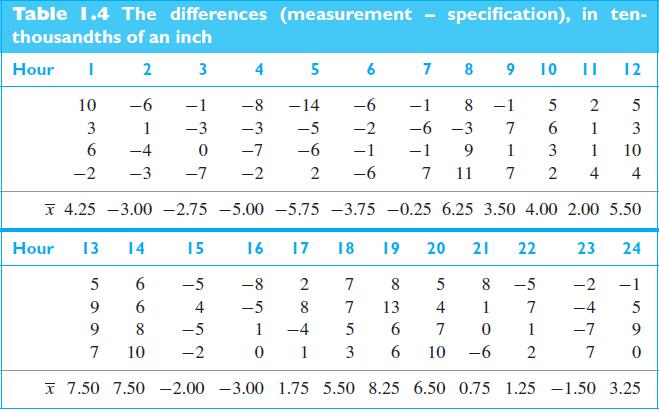
A Canadian manufacturer identified a critical diameter on a crank bore that needed to be maintained within a close tolerance for the product to be successful. Samples of size 4 were taken every hour. The values of the differences (measurement - specification), in tenthousandths of an inch, are given in Table 1.4.
(a) Calculate the central line for an $X$-bar chart for the 24 hourly sample means. The centerline is $\overline{\bar{x}}=(4.25-3.00-\cdots-1.50+3.25) / 24$.
(b) Is the average of all the numbers in the table, 4 for each hour, the same as the average of the 24 hourly averages? Should it be?
(c) A computer calculation gives the control limits
\[\begin{aligned}& \mathrm{LCL}=-4.48 \\& \mathrm{UCL}=7.88\end{aligned}\]
Construct the $X$-bar chart. Identify hours where the process was out of control.
| Hour | I | 2 | 3 | 4 | 5 | 6 | 7 | 8 | 9 | 10 | I I | 12 | |
|---|---|---|---|---|---|---|---|---|---|---|---|---|---|
| 10 | -6 | -1 | -8 | -14 | -6 | -1 | 8 | -1 | 5 | 2 | 5 | ||
| 3 | 1 | -3 | -3 | -5 | -2 | -6 | -3 | 7 | 6 | 1 | 3 | ||
| 6 | -4 | 0 | -7 | -6 | -1 | -1 | 9 | 1 | 3 | 1 | 10 | ||
| -2 | -3 | -7 | -2 | 2 | -6 | 7 | 11 | 7 | 2 | 4 | 4 | ||
| $\bar{x} \quad 4.25$ | -3.00 | -2.75 | -5.00 | -5.75 | $5-3.7$ | $75-0$ | 0.256 | 6.253 | 3.50 | 4.00 | 2.00 | 5.50 | |
| Hour | 13 | 14 | 15 | 16 | 17 | 18 | 19 | 20 | 21 | 22 | 23 | 24 | |
| 5 | 6 | -5 | -8 | 2 | 7 | 8 | 5 | 8 | $3-1$ | -5 | -2 | -1 | |
| 9 | 6 | 4 | -5 | 8 | 7 | 13 | 4 | 1 | 1 | 7 | -4 | 5 | |
| 9 | 8 | -5 | 1 | -4 | 5 | 6 | 7 | 0 | ) | 1 | -7 | 9 | |
| 7 | 10 | -2 | 0 | 1 | 3 | 6 | 10 | -6 | 2 | 7 | 0 | ||
| $\bar{x}$ | 7.50 | 7.50 | -2.00 | -3.00 | 1.75 | 5.50 | 8.25 | 6.50 | 0.75 | $5 \quad 1.2$ | $25-$ | -1.50 | 3.25 |
Data From Table 1.4
Step by Step Answer:


Probability And Statistics For Engineers
ISBN: 9780134435688
9th Global Edition
Authors: Richard Johnson, Irwin Miller, John Freund
