

Question: Examine the three dotplots generated by MINITAB shown in Figure 1.12. Describe these distributions in terms of their locations and shapes. FIGURE 1.12 Shapes of
Examine the three dotplots generated by MINITAB shown in Figure 1.12. Describe these distributions in terms of their locations and shapes.
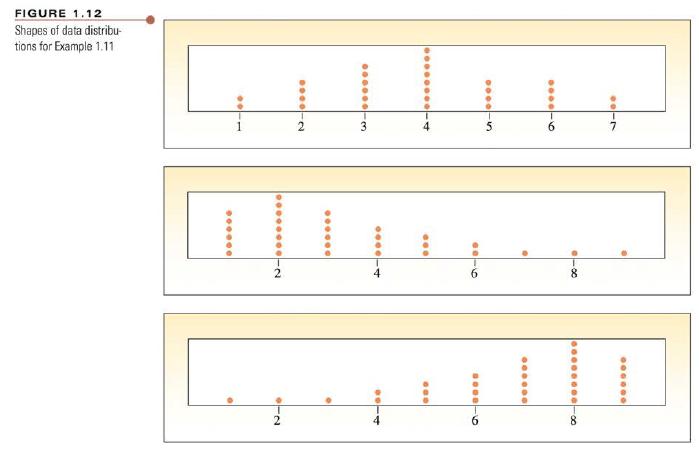
FIGURE 1.12 Shapes of data distribu- tions for Example 1.11 -2 N. 6 GOOD 6
Step by Step Solution
There are 3 Steps involved in it
1 Expert Approved Answer
Step: 1 Unlock

Question Has Been Solved by an Expert!
Get step-by-step solutions from verified subject matter experts
Step: 2 Unlock
Step: 3 Unlock