

Question: For any 11 observations, (a) Use software or Table 3 to verify the normal scores (-1.38-0.97-0.67-0.43-0.21 quad 0 quad 0.210 .430 .670 .971 .38) (b)
For any 11 observations,
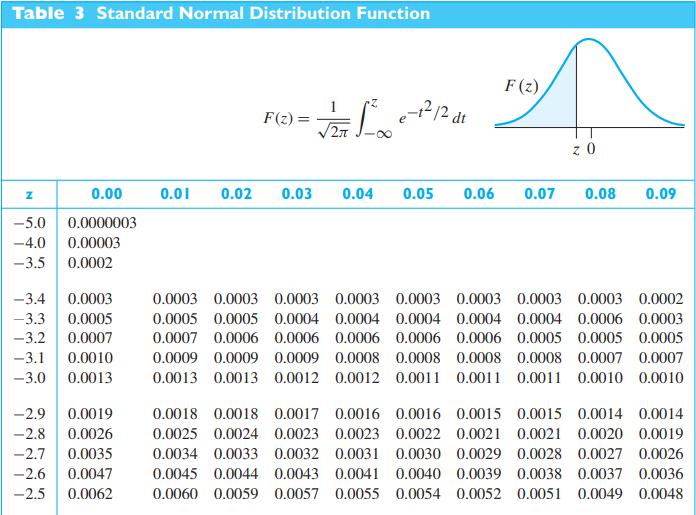
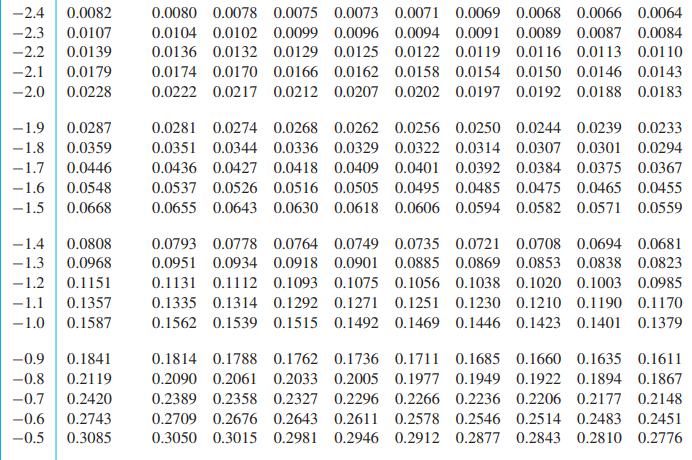
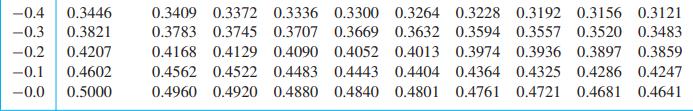
(a) Use software or Table 3 to verify the normal scores \(-1.38-0.97-0.67-0.43-0.21 \quad 0 \quad 0.210 .430 .670 .971 .38\)
(b) Construct a normal scores plot using the observations on the times between neutrinos in Exercise 2.7.
Data From Table 3
Data From Exercise 2.7
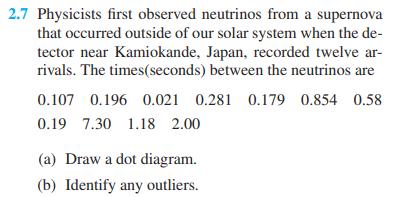
Table 3 Standard Normal Distribution Function F(z) 12 dt F(z) = 2 z O Z 0.00 0.01 0.02 0.03 0.04 0.05 0.06 0.07 0.08 0.09 -5.0 0.0000003 -4.0 0.00003 -3.5 0.0002 -3.4 0.0003 -3.3 0.0005 -3.2 0.0007 -3.1 0.0010 -3.0 0.0013 -2.9 0.0019 -2.8 0.0026 -2.7 0.0035 -2.6 0.0047 -2.5 0.0062 0.0003 0.0003 0.0003 0.0003 0.0003 0.0003 0.0003 0.0003 0.0002 0.0005 0.0005 0.0004 0.0004 0.0004 0.0004 0.0004 0.0006 0.0003 0.0007 0.0006 0.0006 0.0006 0.0006 0.0006 0.0005 0.0005 0.0005 0.0009 0.0009 0.0009 0.0008 0.0008 0.0008 0.0008 0.0007 0.0007 0.0013 0.0013 0.0012 0.0012 0.0011 0.0011 0.0011 0.0010 0.0010 0.0018 0.0018 0.0017 0.0016 0.0016 0.0015 0.0015 0.0014 0.0014 0.0025 0.0024 0.0023 0.0023 0.0022 0.0021 0.0021 0.0020 0.0019 0.0034 0.0033 0.0032 0.0031 0.0030 0.0029 0.0028 0.0027 0.0026 0.0045 0.0044 0.0043 0.0041 0.0040 0.0039 0.0038 0.0037 0.0036 0.0060 0.0059 0.0057 0.0055 0.0054 0.0052 0.0051 0.0049 0.0048
Step by Step Solution
3.33 Rating (153 Votes )
There are 3 Steps involved in it

Get step-by-step solutions from verified subject matter experts