

Question: Plot the curve obtained in the preceding exercise and the one obtained in Exercise 11.26 on one diagram and compare the fit of these two
Plot the curve obtained in the preceding exercise and the one obtained in Exercise 11.26 on one diagram and compare the fit of these two curves.
Data From Exercise 11.26
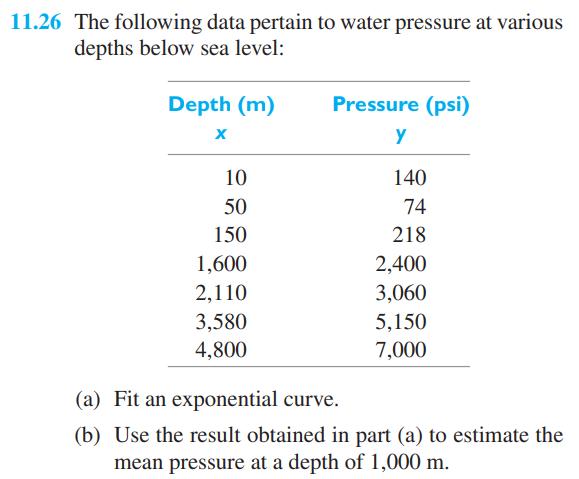
11.26 The following data pertain to water pressure at various depths below sea level: Depth (m) Pressure (psi) x y 10 140 50 74 150 218 1,600 2,400 2,110 3,060 3,580 5,150 4,800 7,000 (a) Fit an exponential curve. (b) Use the result obtained in part (a) to estimate the mean pressure at a depth of 1,000 m.
Step by Step Solution
★★★★★
3.48 Rating (148 Votes )
There are 3 Steps involved in it
1 Expert Approved Answer
Step: 1 Unlock

Question Has Been Solved by an Expert!
Get step-by-step solutions from verified subject matter experts
Step: 2 Unlock
Step: 3 Unlock