

Question: The data from Example 11.4 involving breakfast and the attention spans of three groups of elementary students were analyzed using MINITAB. The graphs in Figure
The data from Example 11.4 involving breakfast and the attention spans of three groups of elementary students were analyzed using MINITAB. The graphs in Figure 11.12, gen- erated by MINITAB, are the normal probability plot and the residuals versus fit plot for this experiment. Look at the straight-line pattern in the normal probability plot, which indicates a normal distribution in the residuals. In the other plot, the residuals are plot- ted against the estimated expected values, which are the sample averages for each of the three treatments in the completely randomized design. The random scatter around the horizontal "zero error line" and the constant spread indicate no violations in the constant variance assumption.
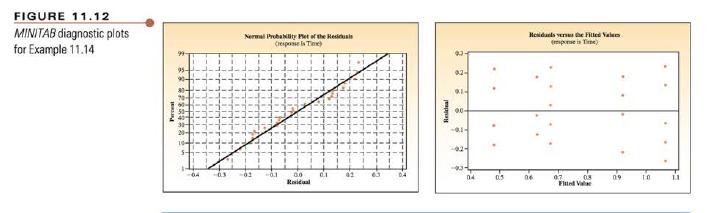
FIGURE 11.12 MINITAB diagnostic plots for Example 11.14 Percent 99 95- 90- 30+ 70- 10+ Normal Probability Pet of the Residuals ( -04 -0.3 -03 -0.1 0.0 Residual 01 02 03 Residual 02- 02- 91- 00- -01- -02- Heidelser the Fil mpose is Time) 04 05 06 07 08 09 10 11 F
Step by Step Solution
There are 3 Steps involved in it

Get step-by-step solutions from verified subject matter experts