

Question: The data in Table 15.9 were collected using a completely randomized design. They are the achievement test scores for four different groups of students, each
The data in Table 15.9 were collected using a completely randomized design. They are the achievement test scores for four different groups of students, each group taught by a different teaching technique. The objective of the experiment is to test the hypothesis of no difference in the population distributions of achievement test scores versus the alternative that they differ in location; that is, at least one of the distributions is shifted above the others. Conduct the test using the Kruskal-Wallis H test with = 0.05.
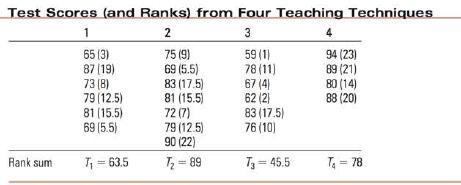
Test Scores (and Ranks) from Four Teaching Techniques 1 2 3 4 65 (3) 75 (9) 59 (1) 94 (23) 87 (19) 69 (5.5) 78 (11) 89 (21) 73 (8) 83 (17.5) 67 (4) 80 (14) 79 (12.5) 81 (15.5) 62 (2) 88 (20) 81 (15.5) 72 (7) 83 (17.5) 69 (5.5) 79 (12.5) 76 (10) 90 (22) Rank sum T = 63.5 T=89 T3-45.5 T =78
Step by Step Solution
There are 3 Steps involved in it

Get step-by-step solutions from verified subject matter experts