

The pictogram of Figure 2.11 is intended to illustrate the fact that per capita income in the
Question:
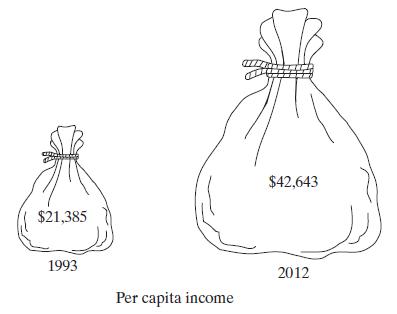
The pictogram of Figure 2.11 is intended to illustrate the fact that per capita income in the United States doubled from $\$ 21,385$ in 1993 to $\$ 42,643$ in 2012. Does this pictogram convey a fair impression of the actual change? If not, state how it might be modified.
Fantastic news! We've Found the answer you've been seeking!
Step by Step Answer:
Answer The pictogram in Figure 211 may mislead viewers due to how the human brain perceives volume r...View the full answer

Answered By
OTIENO OBADO
I have a vast experience in teaching, mentoring and tutoring. I handle student concerns diligently and my academic background is undeniably aesthetic
3+ Reviews
10+ Question Solved
Related Book For 

Probability And Statistics For Engineers
ISBN: 9780134435688
9th Global Edition
Authors: Richard Johnson, Irwin Miller, John Freund
Question Posted:
