

Question: Two-Sample t Test Assuming Unequal Variances 1. Refer to Example 10.21. If the ratio of the two sample variances had been so large that you
Two-Sample t Test Assuming Unequal Variances 1. Refer to Example 10.21. If the ratio of the two sample variances had been so large that you could not assume equal variances (we use "greater than 3" as a rule of thumb), you should select Data Data Analysis t-Test: Two- Sample Assuming Unequal Variances. 2. Follow the directions for the equal variances t test in Example 10.21, and you will generate similar output. If we use this test on the data from Example 10.21, the following output results (Figure 10.21).
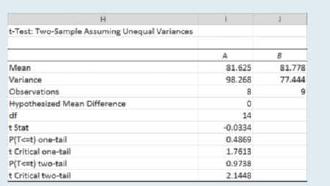
3. You will see slight differences in the observed value of the test statistic, the degrees of freedom, and the p-values for the test, but the conclusions did not change.
H t-Test: Two-Sample Assuming Unequal Variances Mean Variance Observations Hypothesized Mean Difference df Stat P(Test) one-tail t Critical one-tail P(Test) two-tail t Critical two-tail 81.625 81.778 98.268 77.444 14 -0.0334 0.4869 1.7613 0.9738 2.1448
Step by Step Solution
There are 3 Steps involved in it

Get step-by-step solutions from verified subject matter experts