

Question: Two-Sample t Test The test scores on the same algebra test were recorded for nine students randomly selected from a classroom taught by Teacher A
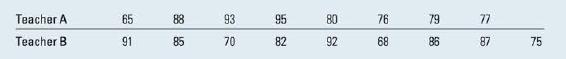
Two-Sample t Test The test scores on the same algebra test were recorded for nine students randomly selected from a classroom taught by Teacher A and eight students randomly selected from a classroom taught by Teacher B. Is there a difference in the average scores for students taught by these two teachers?
1. The data can be entered into the worksheet in one of three ways: . Enter measurements from both samples into a single column and enter letters (A or B) in a second column to identify the sample from which the measurement comes. Enter the samples in two separate columns. If you do not have the raw data, but rather have summary statistics, MINITAB 16 will allow you to use these values by selecting "Summarized data" and entering the appropriate values in the boxes. 2. Use the second method and enter the data into two columns of the worksheet. Use Stat Basic Statistics Display Descriptive Statistics to find the stan- dard deviations for the two samples, s = 9.91 and s = 8.80. Since the ratio of the two variances is s/s = 1.27 (less than 3), you are safe in assuming that the population variances are the same. 3. Select Stat Basic Statistics 2-Sample t to generate the dialogue box in Figure 10.25(a). Check "samples in different columns," selecting the appropri- ate columns from the list at the left. Check the "Assume equal variances" box and select the proper alternative in the Options box. The two-sample output when you click OK twice automatically contains a 95% one- or two-sided confidence interval as well as the test statistic and p-value (you can change the confidence coefficient if you wish). The output is shown in Figure 10.25(b).
Teacher A 65 88 Teacher B 91 88 93 95 80 85 70 82 92 38 76 68 28 79 77 86 87 75 5
Step by Step Solution
There are 3 Steps involved in it

Get step-by-step solutions from verified subject matter experts