

Question: With reference to the (n=50) interrequest time observations in Example 6, Chapter 2, which have mean 11,795 and standard deviation 14,056, what can one assert
With reference to the \(n=50\) interrequest time observations in Example 6, Chapter 2, which have mean 11,795 and standard deviation 14,056, what can one assert with \(95 \%\) confidence about the maximum error if \(\bar{x}=11,795\) is used as a point estimate of the true population mean inter-request time?
Data From Example 6
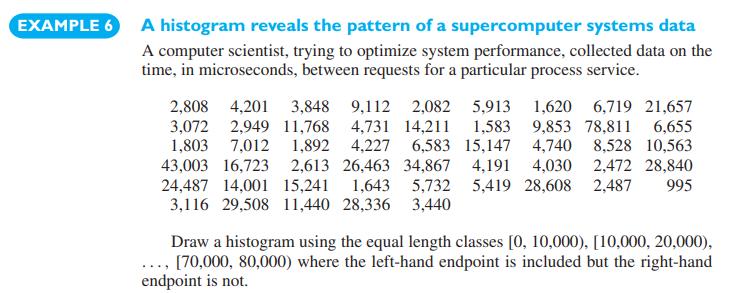
EXAMPLE 6 A histogram reveals the pattern of a supercomputer systems data A computer scientist, trying to optimize system performance, collected data on the time, in microseconds, between requests for a particular process service. 2,808 4,201 3,848 9,112 2,082 3,072 2,949 11,768 4,731 14,211 1,803 7,012 1,892 4,227 6,583 43,003 16,723 2,613 26,463 34,867 24,487 14,001 15,241 1,643 5,732 3,116 29,508 11,440 28,336 3,440 5,913 1,620 6,719 21,657 1,583 15,147 4,191 5,419 28,608 2,487 995 9,853 78,811 6,655 4,740 8,528 10,563 4,030 2,472 28,840 Draw a histogram using the equal length classes [0, 10,000), [10,000, 20,000), ..., [70,000, 80,000) where the left-hand endpoint is included but the right-hand endpoint is not.
Step by Step Solution
3.38 Rating (157 Votes )
There are 3 Steps involved in it

Get step-by-step solutions from verified subject matter experts