

Question: Make your own version of Table 3.10. Assume the point of the table is to compare the relative sizes and the relative ratio of equity
Make your own version of Table 3.10. Assume the point of the table is to compare the relative sizes and the relative ratio of equity to assets of leading banks with those of leading oil companies.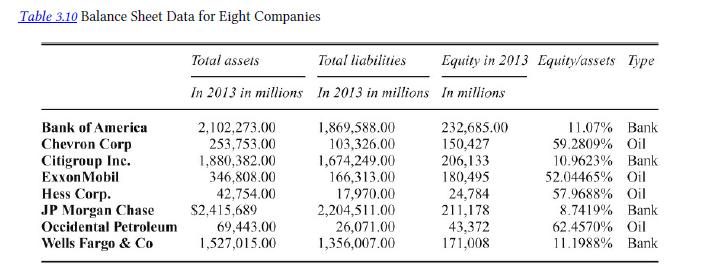
Table 3.10 Balance Sheet Data for Eight Companies Bank of America Chevron Corp Citigroup Inc. ExxonMobil Hess Corp. JP Morgan Chase Occidental Petroleum Wells Fargo & Co Total assets Total liabilities Equity in 2013 Equity/assets Type In 2013 in millions In 2013 in millions In millions 2,102,273.00 253,753.00 1,869,588.00 232,685.00 103,326.00 150,427 11.07% 59.2809% Oil Bank 1,880,382.00 1,674,249.00 206,133 346,808.00 166,313.00 180,495 10.9623% 52.04465% Oil Bank 42,754.00 17,970.00 24,784 57.9688% Oil $2,415,689 2,204,511.00 211,178 8.7419% Bank 69,443.00 1,527,015.00 26,071.00 1,356,007.00 43,372 62.4570% Oil 171,008 11.1988 % Bank
Step by Step Solution
3.51 Rating (164 Votes )
There are 3 Steps involved in it

Get step-by-step solutions from verified subject matter experts