

Consider a log-linear regression for the weekly sales (number of cans) of a national brand of canned
Question:
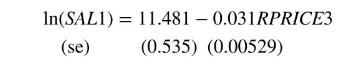
Consider a log-linear regression for the weekly sales (number of cans) of a national brand of canned tuna \((S A L 1=\) target brand sales \()\) as a function of the ratio of its price to the price of a competitor, \(\quad\) RPRICE3 \(=100\) (price of target brand \(\div\) price competitive brand \#3), \(\ln (S A L 1)=\gamma_{1}+\) \(\gamma_{2} R P R I C E 3+e\). Using \(N=52\) weekly observations the least squares estimated equation is
a. The variable RPRICE3 is the price of the target brand as a percentage of the price of competitive brand \#3 or more simply "the relative price." The sample mean of RPRICE3 is 99.66 , its median is 100 , its minimum value is 70.11 , and its maximum value is 154.24. What do these summary statistics tell us about the prices of the target brand relative to the prices of its competitor?
b. Interpret the coefficient of RPRICE3. Does its sign make economic sense?
c. Construct and interpret a \(95 \%\) interval estimate for the effect on the weekly sales, SAL1, of a \(1 \%\) increase in the price of the target brand as a percentage of the price of competitive brand \#3, which is relative price RPRICE3.
d. Carry out a test of the null hypothesis \(H_{0}: \gamma_{2} \geq-0.02\) against the alternative \(H_{1}: \gamma_{2}
e. "Hypothesis tests and interval estimators for the regression model are valid as long as the regression error terms are normally distributed." Is this true or false? Explain.
Step by Step Answer:


Principles Of Econometrics
ISBN: 9781118452271
5th Edition
Authors: R Carter Hill, William E Griffiths, Guay C Lim
