

In this exercise, we explore some of the factors predicting costs at American public universities using the
Question:
In this exercise, we explore some of the factors predicting costs at American public universities using the data file pubcoll. Let \(T C=\) the real \((\$ 2008)\) total cost per student, \(F T U G=\) number of full-time undergraduate students, FTGRAD = number of full-time graduate students, \(F T E F=\) full-time faculty per 100 students, \(C F=\) number of contract faculty per 100 students, and FTENAP = full-time nonacademic professionals per 100 students. Use only the data for years prior to 2008 . Include in the model year indicator variables D1989, D1991, D1999, and D2005.
a. Estimate the regression of \(\ln (T C)\) on the remaining variables. What are the predicted effects of additional undergraduate students and graduate students on total cost per student?
b. What are the predicted effects of additional full-time faculty, contract faculty, and nonacademic professionals on total cost per student?
c. Using the estimates from part (a), compute the normal and corrected predictors of total cost using 2005 data for University of Arizona (unitid = 104179), Indiana University-Bloomington (unitid 151351), and The University of Texas at Austin (unitid = 228778). Compare the predicted values to the reported \(T C\) for 2005 . Which schools had actual total cost \(T C\) higher than predicted?
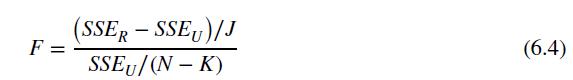
d. Add an indicator variable for each different university except the first, which is the reference group. Test the joint significance of these indicator variables at the \(5 \%\) level of significance using the \(F\)-test given in equation (6.4). Are there individual differences among the universities?
e. Using the estimates from part (d), compute the normal and corrected predictors of total cost using 2005 data for University of Arizona (unitid = 104179), Indiana University-Bloomington (unitid 151351), and The University of Texas at Austin (unitid = 228778). Compare the predicted values to the reported \(T C\) for 2005 . Which schools had actual total cost \(T C\) higher than predicted?
Data From Equation 6.4:-
Step by Step Answer:


Principles Of Econometrics
ISBN: 9781118452271
5th Edition
Authors: R Carter Hill, William E Griffiths, Guay C Lim
