

The file wa-wheat.dat contains observations on wheat yield in Western Australian shires. There are 48 annual observations
Question:
The file wa-wheat.dat contains observations on wheat yield in Western Australian shires. There are 48 annual observations for the years 1950-1997. For the Northampton shire, consider the following four equations:
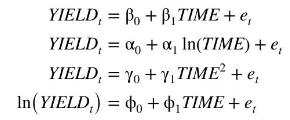
a. Estimate each of the four equations. Taking into consideration (i) plots of the fitted equations, (ii) plots of the residuals, (iii) error normality tests, and (iii) values for \(R^{2}\), which equation do you think is preferable? Explain.
b. Interpret the coefficient of the time-related variable in your chosen specification.
c. Using your chosen specification, identify any unusual observations, based on the studentized residuals, LEVERAGE, DFBETAS, and DFFITS.
d. Using your chosen specification, use the observations up to 1996 to estimate the model. Construct a 95\% prediction interval for YIELD in 1997. Does your interval contain the true value?
Step by Step Answer:


Principles Of Econometrics
ISBN: 9781118452271
5th Edition
Authors: R Carter Hill, William E Griffiths, Guay C Lim
