

Question: The following scatterplot shows the age and weight for some women. Some of them exercised regularly, and some did not. Explain what it means that
The following scatterplot shows the age and weight for some women. Some of them exercised regularly, and some did not. Explain what it means that the blue line (for those who did not exercise) is a bit steeper than the red line (for those who did exercise)
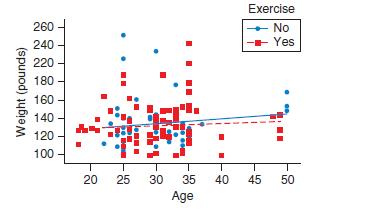
Exercise 260 No 240 -- Yes 220 180 160 140 120 100 20 25 30 35 40 45 50 Age (spunod) j4bie M
Step by Step Solution
★★★★★
3.40 Rating (172 Votes )
There are 3 Steps involved in it
1 Expert Approved Answer
Step: 1 Unlock

The blue line for those who did not exercise being steeper than t... View full answer
Question Has Been Solved by an Expert!
Get step-by-step solutions from verified subject matter experts
Step: 2 Unlock
Step: 3 Unlock