

The following table in Exercise 2.30 shows the average life span for some mammals in years, according
Question:
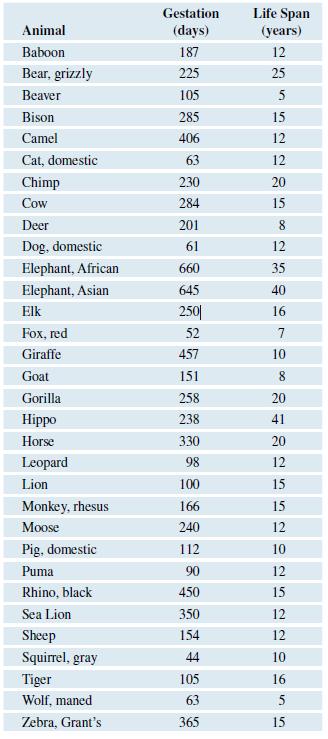
The following table in Exercise 2.30 shows the average life span for some mammals in years, according to info please. com. Graph these average life spans and describe the distribution. What is a typical life span? Identify the three outliers and report their life spans. If you were to include humans in this graph, where would the data point be? Humans live an average of about 75 years.
Data from Exercise 2.30
The accompanying table also shows the gestation period (in days) for some animals. The gestation period is the length of pregnancy. Graph the gestation period and describe the distribution. If there are any outliers, identify the animal(s) and give the gestation periods. If you were to include humans in this graph, where would the data point be? The human gestation period is about 266 days.
Step by Step Answer:
ANSWER The average life spans of the mammals are distributed in ...View the full answer


Introductory Statistics Exploring The World Through Data
ISBN: 9780135163146
3rd Edition
Authors: Robert Gould, Rebecca Wong, Colleen N. Ryan
