

Question: The scatterplot below shows data on age of a sample students and the number of college credits attained. Comment on the strength, direction, and shape
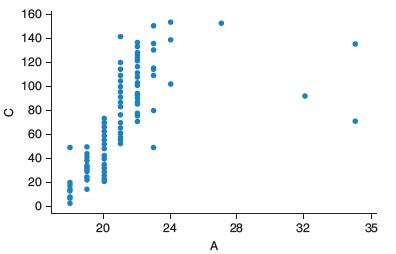
The scatterplot below shows data on age of a sample students and the number of college credits attained. Comment on the strength, direction, and shape of the trend.
160 140 - 120 - 100 - 80 - 60 - 40 - 20 20 24 28 32 35 A ..
Step by Step Solution
★★★★★
3.46 Rating (166 Votes )
There are 3 Steps involved in it
1 Expert Approved Answer
Step: 1 Unlock

Final answer Up to the age of 24 the trend is linear positive and strong after that it turns weak an... View full answer
Question Has Been Solved by an Expert!
Get step-by-step solutions from verified subject matter experts
Step: 2 Unlock
Step: 3 Unlock