

Question: The scatterplot shows the acceptance rate and selectivity index for a sample of medical schools. The acceptance rate is the percentage of applicants who were
The scatterplot shows the acceptance rate and selectivity index for a sample of medical schools. The acceptance rate is the percentage of applicants who were accepted into the medical school. The selectivity index is a measure based on GPA, test scores, and acceptance rates. A higher index indicates a more selective school. Do you think the correlation coefficient among these variables is positive, negative, or near zero? Give a reason for your choice. (Accepted.com)
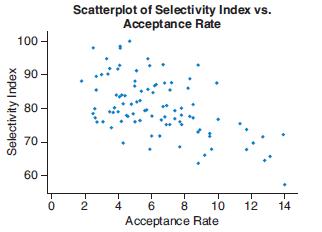
Scatterplot of Selectivity Index vs. Acceptance Rate 100 90 - 80 70- 60 - 4 6 8 10 12 14 Acceptance Rate Selectivity Index 2-
Step by Step Solution
3.40 Rating (159 Votes )
There are 3 Steps involved in it
Given this inverse relationship the correlation co... View full answer

Get step-by-step solutions from verified subject matter experts