

Question: Use the data in the previous question to find all the pairwise confidence intervals for the difference in the population means. How do these confidence
Use the data in the previous question to find all the pairwise confidence intervals for the difference in the population means. How do these confidence intervals support your conclusion in the previous problem?
Previous question
The following table shows the number of hits for a random sample of Major League Baseball players two months into the season. The table shows data for samples of three positions: shortstop, left field, and first base.
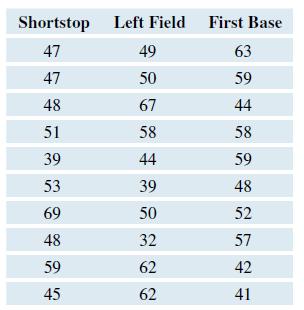
Left Field First Base 47 49 63 47 50 59 48 67 44 51 58 58 39 44 59 53 39 48 69 50 52 48 32 57 59 62 42 45 62 41
Step by Step Solution
3.53 Rating (167 Votes )
There are 3 Steps involved in it

Get step-by-step solutions from verified subject matter experts