

Question: Using NHANES data, we performed one-way ANOVA and a two-sample t-test. In both cases we were testing the hypothesis that the mean cholesterol values for
Using NHANES data, we performed one-way ANOVA and a two-sample t-test. In both cases we were testing the hypothesis that the mean cholesterol values for men and women are different. Compare the output of ANOVA and the two-sample t-test by looking at the t-statistics, F-statistics, and p-values.
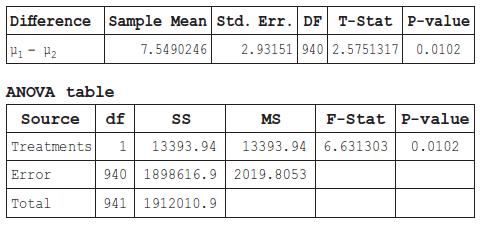
Difference Sample Mean std. Err. DF T-Stat P-value 7.5490246 2.93151 940 2.5751317 0.0102 ANOVA table Source df MS F-Stat P-value Treatments 1 13393.94 13393.94 6.631303 0.0102 Error 940 1898616.9 2019.8053 Total 941 1912010.9
Step by Step Solution
3.36 Rating (168 Votes )
There are 3 Steps involved in it
Without access to the actual output from the ANOVA and twosample ttest we cannot provide a direct comparison of their tstatistics Fstatistics and pval... View full answer

Get step-by-step solutions from verified subject matter experts