

Question: Input the data from the table into a spreadsheet. Compute the serial correlation in decade returns for each asset class and for inflation. Also find
Input the data from the table into a spreadsheet. Compute the serial correlation in decade returns for each asset class and for inflation. Also find the correlation between the returns of various asset classes. What do the data indicate?
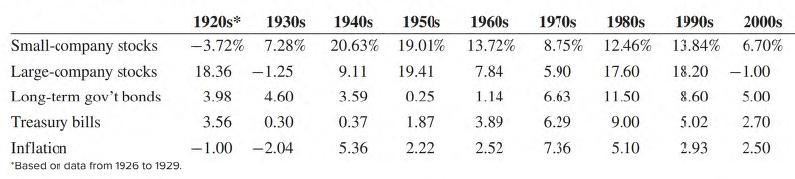
Small-company stocks Large-company stocks Long-term gov't bonds Treasury bills Inflation *Based or data from 1926 to 1929. 1920s* 1930s 1940s 1950s 1960s 1970s 1980s 1990s 2000s -3.72% 7.28% 20.63% 19.01% 13.72% 8.75% 12.46% 6.70% 13.84% 17.60 18.20 - 1.00 18.36 -1.25 9.11 19.41 3.98 4.60 3.59 0.25 11.50 8.60 5.00 3.56 0.30 0.37 1.87 9.00 5.02 2.70 -1.00 -2.04 5.36 2.22 5.10 2.93 2.50 7.84 1.14 3.89 2.52 5.90 6.63 6.29 7.36
Step by Step Solution
3.47 Rating (170 Votes )
There are 3 Steps involved in it
Rearrange the table converting rows to columns and compute serial correlation results in the follo... View full answer

Get step-by-step solutions from verified subject matter experts