

In Figure 98, Investor G plots two securities relative to the SML. Based on Investor Gs analysis,
Question:
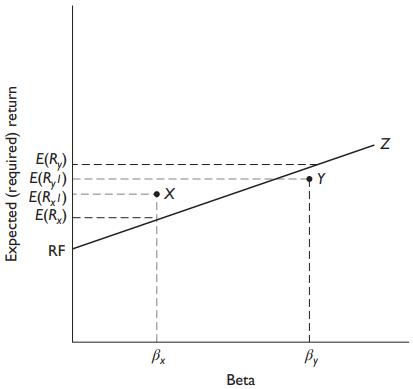
In Figure 9‐8, Investor G plots two securities relative to the SML. Based on Investor G’s analysis, Security X has a relatively high estimated return derived from fundamental analysis and plots above the SML; Security Y has a relatively low estimated return and plots below the SML. Based on Investor G’s analysis, which is undervalued? Security X, plotting above the SML, is undervalued because its estimated return is higher than required, given its level of systematic risk. Investors require a return of E(RX) , but Security X, according to Investor G’s fundamental analysis, is offering E(RXI). Investor G should purchase Security X. If other investors recognize the same mispricing as Investor G, they will do the following:
Purchase Security X, because its estimated return offers more return than required. This demand will drive up the price of X, as more of it is purchased. Investor G gains as the price is driven up by other investor trading. The return will be driven down, until it is at the level indicated by the SML.
Now consider Security Y. This security, according to Investor G’s fundamental analysis, does not offer enough expected return given its level of systematic risk. Investors require E(RY) for Security Y, based on the SML, but Y offers only E(RYI). Investor G should short sell Security Y. If other investors recognize the same mispricing as Investor G, they will do the following:
Sell Security Y (or perhaps sell Y short), because it offers less than the required return. This increase in the supply of Y will drive down its price. Investor G gains as the price is driven down by the trading activity of the other investors. The return will be driven up for new buyers because any dividends paid are now relative to a lower price, as is any expected price appreciation. The price will fall until the expected return rises enough to reach the SML and the security is once again in equilibrium.
Figure 9‐8
Step by Step Answer:


Investments Analysis And Management
ISBN: 9781118975589
13th Edition
Authors: Charles P. Jones, Gerald R. Jensen
