

Question: PP 8.3 Write a program that creates a histogram that allows you to visually inspect the frequency distribution of a set of values. The
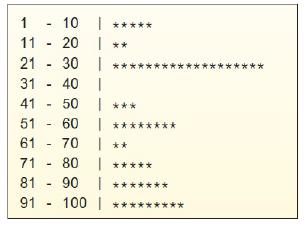
PP 8.3 Write a program that creates a histogram that allows you to visually inspect the frequency distribution of a set of values. The program should read in an arbitrary number of integers from a text input file that are in the range 1 to 100 inclusive; then produce a chart similar to the one below that indicates how many input values fell in the range 1 to 10, 11 to 20, and so on. Print one asterisk for each value entered.
Step by Step Solution
★★★★★
3.49 Rating (156 Votes )
There are 3 Steps involved in it
1 Expert Approved Answer
Step: 1 Unlock

Question Has Been Solved by an Expert!
Get step-by-step solutions from verified subject matter experts
Step: 2 Unlock
Step: 3 Unlock