

Question: Let g(t) be defined as in Exercise 25. Its graph is called a quadratic Bzier curve, and it is used in some computer graphics designs.
Let g(t) be defined as in Exercise 25. Its graph is called a quadratic Bézier curve, and it is used in some computer graphics designs. The points p0, p1, and p2 are called the control points for the curve. Compute a formula for g(t) that involves only p0, p1, and p2. Then show that g(t) is in conv {p0; p1; p2} for 0 ≤ t ≤ 1.
Data From Exercise 25
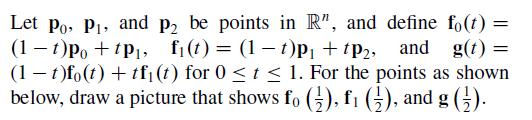
Let Po, P, and p2 be points in R", and define fo(t) = (1 t)Po +tP, f(t) = (1-t)p + tp, and g(t) = (1 t)fo(t) + tf (t) for 0 t 1. For the points as shown below, draw a picture that shows fo (), f (2), and g ().
Step by Step Solution
3.32 Rating (155 Votes )
There are 3 Steps involved in it
gt 1 tfot tfit 1 t1 tpo tp t1 tp tp 1 tpo 2t1 tp ... View full answer

Get step-by-step solutions from verified subject matter experts