

Question: The consumption matrix C below is based on inputoutput data for the U.S. economy in 1958, with data for 81 sectors grouped into 7 larger
The consumption matrix C below is based on input–output data for the U.S. economy in 1958, with data for 81 sectors grouped into 7 larger sectors: (1) nonmetal household and personal products, (2) final metal products (such as motor vehicles), (3) basic metal products and mining, (4) basic nonmetal products and agriculture, (5) energy, (6) services, and (7) entertainment and miscellaneous products.2 Find the production levels needed to satisfy the final demand d. (Units are in millions of dollars.)
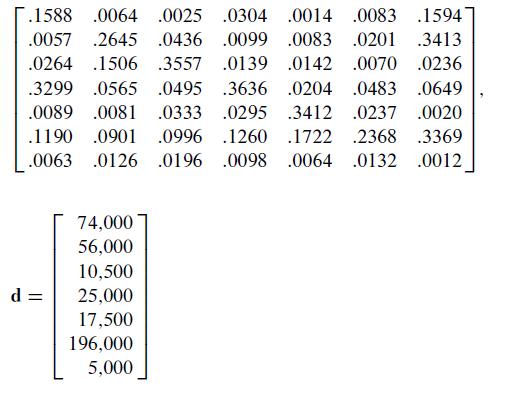
.1588 .0064 .0025 .0304 .0014 .0083 15941 .0057 .2645 .0436 .0099 .0083 .0201 3413 .0264 1506 3557 .0139 .0142 .0070 .0236 .3299 .0565 0495 3636 .0204 .0483 .0649 .0089 .0081 .0333 .0295 .3412 .0237 .0020 .1190 0901 .0996 1260 1722 3369 .0063 .0126 .0196 .0098 .0064 .0132 .2368 .0012 d= 74,000 56,000 10,500 25,000 17,500 196,000 5,000
Step by Step Solution
3.44 Rating (160 Votes )
There are 3 Steps involved in it
so x 99576 97703 51321 131570 49488 329554 13835 Since t... View full answer

Get step-by-step solutions from verified subject matter experts