

Question: KEY QUESTION Below is a production possibilities table for consumer goods (automobiles) and capital goods (forklifts): a. Show these data graphically. Upon what specific assumptions
KEY QUESTION Below is a production possibilities table for consumer goods (automobiles) and capital goods (forklifts):
a. Show these data graphically. Upon what specific assumptions is this production possibilities curve based?
b. If the economy is at point C , what is the cost of one more automobile? Of one more forklift? Explain how the production possibilities curve reflects the law of increasing opportunity costs.
c. If the economy characterized by this production possibilities table and curve were producing 3 automobiles and 20 fork lifts, what could you conclude about its use of its available resources?
d. What would production at a point outside the production possibilities curve indicate? What must occur before the economy can attain such a level of production?
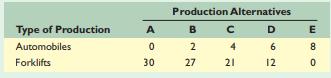
Production Alternatives Type of Production A B C D E Automobiles 0 2 4 6 8 Forklifts 30 27 21 12 0
Step by Step Solution
There are 3 Steps involved in it

Get step-by-step solutions from verified subject matter experts