

Draw a graph with Level of real output on the vertical axis and Time on the horizontal
Question:
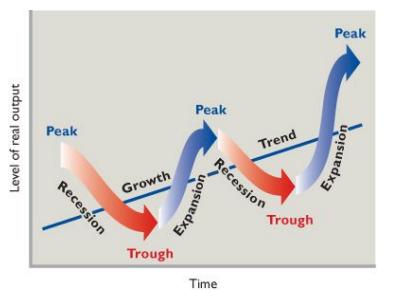
Draw a graph with “Level of real output” on the vertical axis and “Time” on the horizontal axis. If the long-run trend line of economic growth for the United States were to appear on your graph as a straight upsloping line, how would you pencil in economic fluctuations in relation to that straight line? Referring to your graph, briefly explain why economic fluctuations and economic growth are compatible concepts. Check your drawing against Figure 9.1.
Figure 9.1:
Fantastic news! We've Found the answer you've been seeking!
Step by Step Answer:
ANSWER Here is the graph If the longrun trend line of economic growth for the United States appears ...View the full answer

Answered By
Mugdha Sisodiya
My self Mugdha Sisodiya from Chhattisgarh India. I have completed my Bachelors degree in 2015 and My Master in Commerce degree in 2016. I am having expertise in Management, Cost and Finance Accounts. Further I have completed my Chartered Accountant and working as a Professional.
Since 2012 I am providing home tutions.
2+ Reviews
10+ Question Solved
Related Book For 
Macroeconomics
ISBN: 9780077337728
19th Edition
Authors: Campbell Mcconnell, Stanley Brue, Sean Flynn, Flynn Mcconnell Brue
Question Posted:
