In an opinion column in the New York Times, Mark Rank of Washington University, St. Louis described
Question:
In an opinion column in the New York Times, Mark Rank of Washington University, St. Louis described research he carried out with Thomas A. Hirschl of Cornell University. They tracked individuals between the ages of 25 and 60 over a 44-year period and found that “39 percent of Americans will spend a year in the top 5 percent of the income distribution, 56 percent will find themselves in the top 10 percent, and a whopping 73 percent will spend a year in the top 20 percent of the income distribution.” Rank argues that “this information casts serious doubt on the notion of a rigid class structure in the United States based upon income.”
a. What does Rank mean by a “rigid class structure . . . based upon income”?
b. Why might looking at the distribution of income in a particular year, as we do in Tables 17.5 and 17.6, give a different picture of the state of inequality in the United States than does longitudinal data that tracks individuals over time?
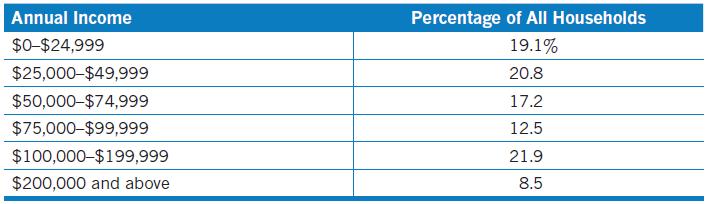
Data given in table 17.5
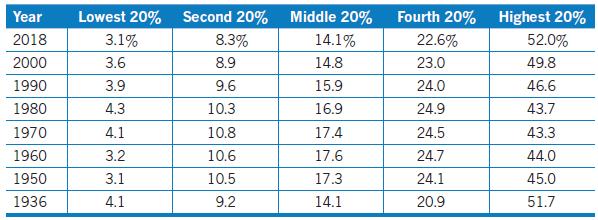
Data given in table 17.6
Step by Step Answer:
a Mark Rank refers to a rigid class structure based upon income as the idea that there are welldefin...View the full answer