

Refer to Figures 1a and 1b in the Appendix. Assume that Q1 is 300, Q2 is 200,
Question:
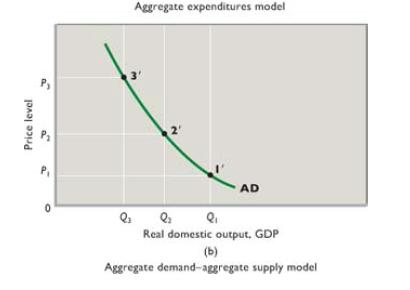
Refer to Figures 1a and 1b in the Appendix. Assume that Q1 is 300, Q2 is 200, Q3 is 100, P3 is 120, P 2 is 100, and P1 is 80. If the price level increases from P1 to P3 in graph 1b, in what direction and by how much will real GDP change? If the slopes of the AE lines in Figure 1a are .8 and equal to the MPC, in what direction will the aggregate expenditures schedule in Figure 1a need to shift to produce the previously determined change in real GDP? What is the size of the multiplier in this example?
Figure 1a:
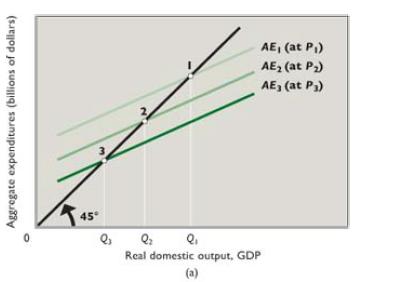
Figure 1b:
Fantastic news! We've Found the answer you've been seeking!
Step by Step Answer:
ANSWER We can see from the graph that as price increases the aggregate expenditure curve shift...View the full answer

Answered By
Rayan Gilbert
I have been teaching since I started my graduation 3 years ago. As a student, working as Teacher/PA has been tough but made me learn the needs for student and how to help them resolve their problems efficiently. I feel good to be able to help out students because I'm passionate about teaching. My motto for teaching is to convey the knowledge I have to students in a way that makes them understand it without breaking a sweat.
1+ Reviews
10+ Question Solved
Related Book For 

Macroeconomics
ISBN: 9780077337728
19th Edition
Authors: Campbell Mcconnell, Stanley Brue, Sean Flynn, Flynn Mcconnell Brue
Question Posted:
