

The accompanying diagram shows data for the interest rate on 10-year euro area government bonds and inflation
Question:
The accompanying diagram shows data for the interest rate on 10-year euro area government bonds and inflation rate for the euro area for 1996 through mid-2014, as reported by the European Central Bank. How would you describe the relationship between the two? How does the pattern compare to that of the United States in Figure 10-8?
Figure 10-8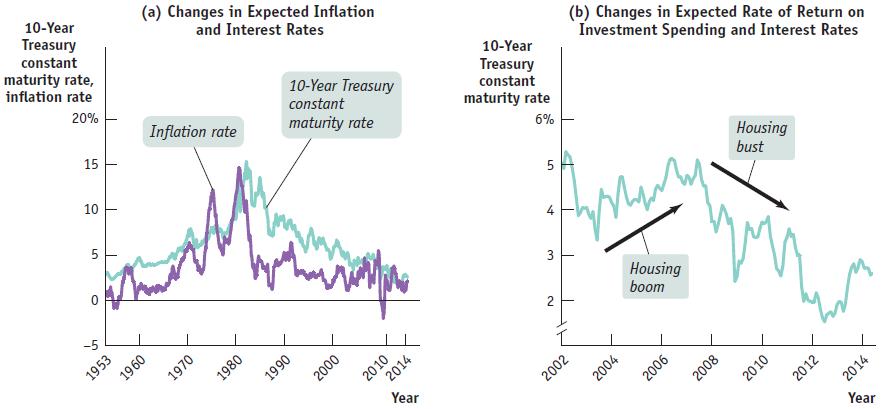
Fantastic news! We've Found the answer you've been seeking!
Step by Step Answer:

Answered By
Loise Ndungu
I have five years of experience as a writer. As I embark on writing your papers from the prologue to the epilogue, my enthusiasm is driven by the importance of producing a quality product. I put premium product delivery as my top priority, as this is what my clients are seeking and what makes me different from other writers. My goal is to craft a masterpiece each time I embark on a freelance work task! I'm a freelance writer who provides his customers with outstanding and remarkable custom writings on various subjects. Let's work together for perfect grades.
78+ Reviews
224+ Question Solved
Related Book For 

Question Posted:
