The diagram below shows an (A D / A S) diagram. The economy begins at (E_{0}) with
Question:
The diagram below shows an \(A D / A S\) diagram. The economy begins at \(E_{0}\) with output equal to \(Y^{*}\). Suppose the government in this closed economy decreases its budget deficit by increasing \(T\) (and keeping \(G\) unchanged), thus causing the \(A D\) curve to shift to the left.
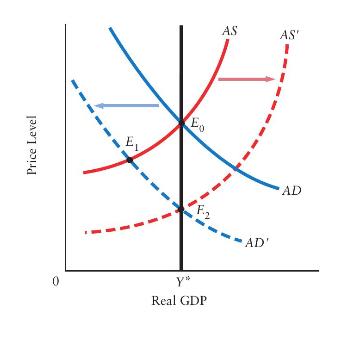
a. How does the interest rate at \(E_{1}\) compare with that at \(E_{0}\) ? Explain.
b. Given your answer to part (a), how does investment at \(E_{1}\) compare with investment at \(E_{0}\) ?
c. Explain the economy's adjustment toward \(E_{2}\). What happens to the interest rate and investment?
d. What is the long-run effect of the government deficit on the growth rate of \(Y^{*}\) ?
e. Comparing the short-run and the long-run effects of this policy, what dilemma does the government face in reducing its deficit?
Step by Step Answer: