

The following figure represents the optimization problem for a homeowner whose home is currently valued at $250,000.
Question:
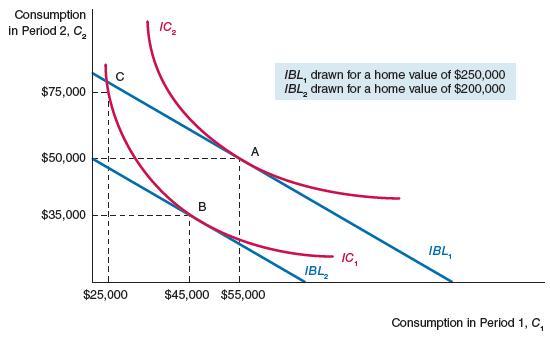
The following figure represents the optimization problem for a homeowner whose home is currently valued at $250,000.
a) Identify the optimum consumption point (i.e., what are the values of C1 and C2 at which this individual’s happiness is maximized?).
b) If the value of the home decreases to $200,000, what is the optimum consumption point?
Fantastic news! We've Found the answer you've been seeking!
Step by Step Answer:
1 Optimum Consumption Point for Home Value 250000 Point A The graph represents an indifferenc...View the full answer

Answered By
Elias Gichuru
am devoted to my work and dedicated in helping my clients accomplish their goals and objectives,providing the best for all tasks assigned to me as a freelancer,providing high quality work that yields high scores.promise to serve them earnestly and help them achieve their goals.i have the needed expertise,knowledge and experience to handle their tasks.
325+ Reviews
859+ Question Solved
Related Book For 

Question Posted:
