

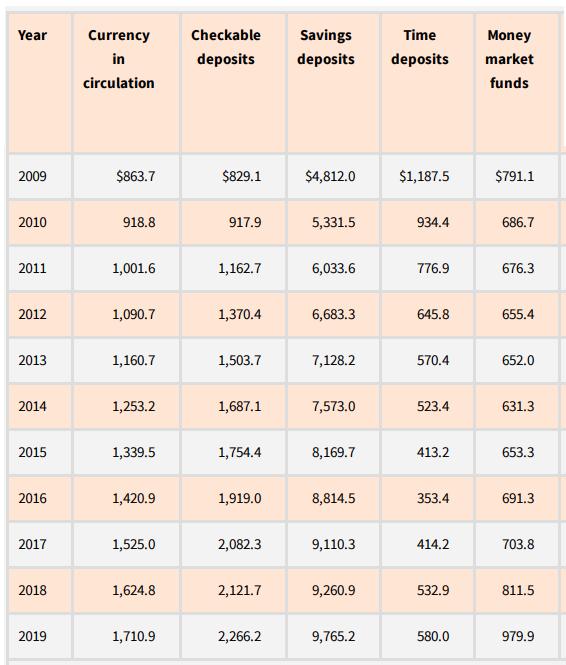
The following table shows the components of M1 and M2 in billions of dollars for the month
Question:
The following table shows the components of M1 and M2 in billions of dollars for the month of December in the years 2009 to 2019 reported by the Federal Reserve Bank of St. Louis. Complete the table by calculating M1, M2, currency in circulation as a percentage of M1, and currency in circulation as a percentage of M2. What trends or patterns about M1, M2, currency in circulation as a percentage of M1, and currency in circulation as a percentage of M2 do you see? What might account for these trends?
Fantastic news! We've Found the answer you've been seeking!
Step by Step Answer:
Completing the Table Year Currency in Circulation Checkable Deposits Savings Deposits Time Deposits ...View the full answer

Answered By
Antony Mutonga
I am a professional educator and writer with exceptional skills in assisting bloggers and other specializations that necessitate a fantastic writer. One of the most significant parts of being the best is that I have provided excellent service to a large number of clients. With my exceptional abilities, I have amassed a large number of references, allowing me to continue working as a respected and admired writer. As a skilled content writer, I am also a reputable IT writer with the necessary talents to turn papers into exceptional results.
2+ Reviews
10+ Question Solved
Related Book For 
Question Posted:
