

The following table shows the inflation rate and output level for four consecutive periods in a given
Question:
The following table shows the inflation rate and output level for four consecutive periods in a given economy. In period 1, the economy is at its long-run equilibrium (i.e., the inflation rate equals its target and output equals potential output). In period 2, there is a temporary supply shock (e.g., an increase in energy prices).
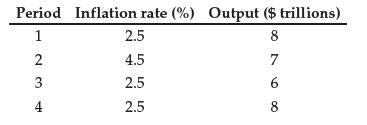
a) Based on the table, determine which type of response was implemented by policy makers (e.g., no response versus stabilizing inflation or economic activity).
b) Show your argument using a graph (draw the MP curve and the AD/AS diagram consistent with the table data).
Fantastic news! We've Found the answer you've been seeking!
Step by Step Answer:
Answer Explanation a Based on the data provided it appears that policymakers implemented a no response approach in the face of the temporary supply shock in period 2 Reasons for this approach Period 1 ...View the full answer

Answered By
Aysha Ali
my name is ayesha ali. i have done my matriculation in science topics with a+ . then i got admission in the field of computer science and technology in punjab college, lahore. i have passed my final examination of college with a+ also. after that, i got admission in the biggest university of pakistan which is university of the punjab. i am studying business and information technology in my university. i always stand first in my class. i am very brilliant client. my experts always appreciate my work. my projects are very popular in my university because i always complete my work with extreme devotion. i have a great knowledge about all major science topics. science topics always remain my favorite topics. i am also a home expert. i teach many clients at my home ranging from pre-school level to university level. my clients always show excellent result. i am expert in writing essays, reports, speeches, researches and all type of projects. i also have a vast knowledge about business, marketing, cost accounting and finance. i am also expert in making presentations on powerpoint and microsoft word. if you need any sort of help in any topic, please dont hesitate to consult with me. i will provide you the best work at a very reasonable price. i am quality oriented and i have 5 year experience in the following field.
matriculation in science topics; inter in computer science; bachelors in business and information technology
_embed src=http://www.clocklink.com/clocks/0018-orange.swf?timezone=usa_albany& width=200 height=200 wmode=transparent type=application/x-shockwave-flash_
11+ Reviews
14+ Question Solved
Related Book For 

Question Posted:
