

Question: The graph shown below is based on quarterly data on unemployment and real output growth in the United States between 2006 (q1) and 2013 (q2).
The graph shown below is based on quarterly data on unemployment and real output growth in the United States between 2006 (q1) and 2013 (q2). Are these data consistent with the real business cycle theory hypothesis regarding the relationship between output and unemployment?
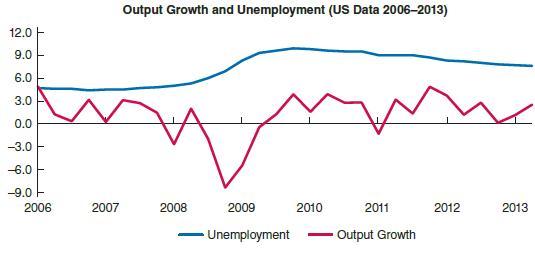
12.0 9.0 6.0 3.0 0.0 -3.0- -6.0 --- -9.0 --- 2006 2007 Output Growth and Unemployment (US Data 2006-2013) 2008 2009 Unemployment 2010 2011 Output Growth 2012 2013
Step by Step Solution
★★★★★
3.38 Rating (154 Votes )
There are 3 Steps involved in it
1 Expert Approved Answer
Step: 1 Unlock

Question Has Been Solved by an Expert!
Get step-by-step solutions from verified subject matter experts
Step: 2 Unlock
Step: 3 Unlock