

The table below shows data for real and nominal GDP for a hypothetical economy over several years.
Question:
The table below shows data for real and nominal GDP for a hypothetical economy over several years.
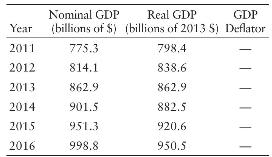
a. Compute the GDP deflator for each year.
b. Compute the total percentage change in nominal GDP from 201 1 to 201 6. How much of this change was due to increases in prices and how much was due to changes in quantities?
Fantastic news! We've Found the answer you've been seeking!
Step by Step Answer:

Answered By
Muhammad Umair
I have done job as Embedded System Engineer for just four months but after it i have decided to open my own lab and to work on projects that i can launch my own product in market. I work on different softwares like Proteus, Mikroc to program Embedded Systems. My basic work is on Embedded Systems. I have skills in Autocad, Proteus, C++, C programming and i love to share these skills to other to enhance my knowledge too.
1+ Reviews
10+ Question Solved
Related Book For 

Question Posted:
