

Use the information in the following table to calculate the percentage change in Fords auto sales from
Question:
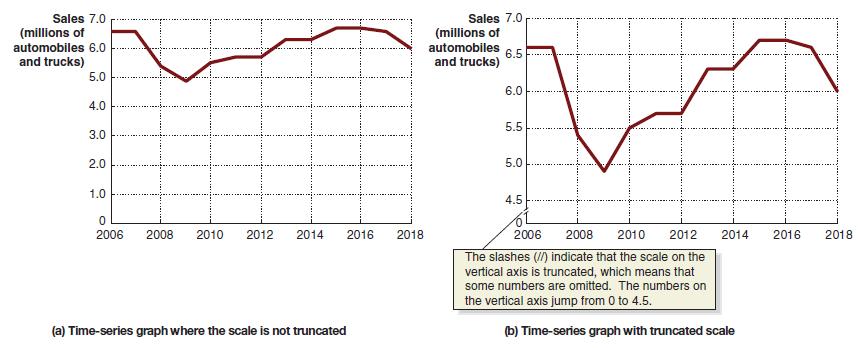
Use the information in the following table to calculate the percentage change in Ford’s auto sales from one year to the next. (These are the data that are graphed in Figure 1A.2.) During which year did sales fall at the highest rate?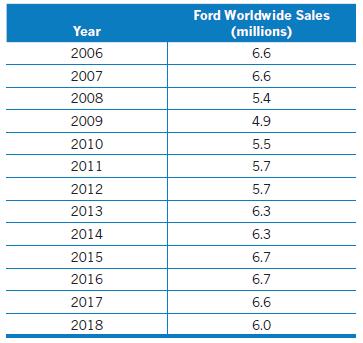
Data given in Graph 1A.2
Fantastic news! We've Found the answer you've been seeking!
Step by Step Answer:
Percentage ChangeNew ValueOld ValueOld value 100 Lets calculate the percentage change for each conse...View the full answer

Answered By
Ann Wangechi
hey, there, paying attention to detail is one of my strong points, i do my very best combined with passion. i enjoy researching since the net is one of my favorite places to be and to learn. i am a proficient and versatile blog, article academic and research writing i possess excellent English writing skills, great proof-reading. i am a good communicator and always provide feedback in real time. i'm experienced in the writing field, competent in computing, essays, accounting and research work and also as a Database and Systems Administrator
151+ Reviews
291+ Question Solved
Related Book For 

Question Posted:
