A closer look at changes in state labor markets There is a lot of discussion of the
Question:
A closer look at changes in state labor markets There is a lot of discussion of the decline of the “Rust Belt” and the differences between labor markets at the state level. The table below is a snapshot of the labor market in California, Ohio, and Texas in 2003 before the Great Financial Crisis, in 2009 at the height of the crisis, and in 2018 after the crisis. Ohio is considered a Rust Belt state.
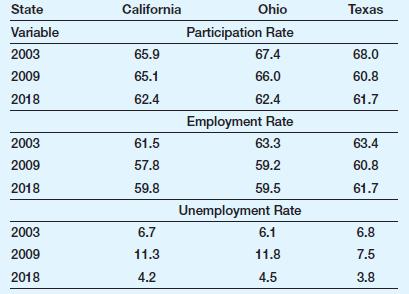
a. In which state did participation rates fall by the largest amount between 2003 and 2018? Is this consistent with the story of economic decline in the Rust Belt?
b. Using the increase in the unemployment rate from 2003 to 2009 to measure economic stress, in what state did the crisis hit hardest?
c. Using the decline in the participation rate from 2003 to 2009 to measure economic stress, in what state did the financial crisis hit hardest?
d. As of 2018, which state has the weakest labor market using all three statistics?
Step by Step Answer: