

Calculate and graph the growth rate of total factor productivity since 1960 using FRED series MFPNFBS. This
Question:
Calculate and graph the growth rate of total factor productivity since 1960 using FRED series MFPNFBS. This series is not the same as used in Table 3.1, but is similar. How would you characterize the movements in productivity since 1960? How do recessions affect the growth rate of productivity? How was productivity affected by the oil shocks of 1973-1975, 1979-1980, 1990, and 2003-2008?
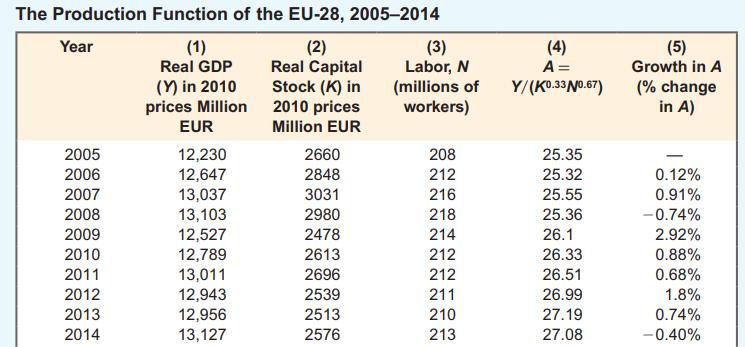
Table 3.1
Step by Step Answer:

This question has not been answered yet.
You can Ask your question!
Related Book For 
Question Posted:
