

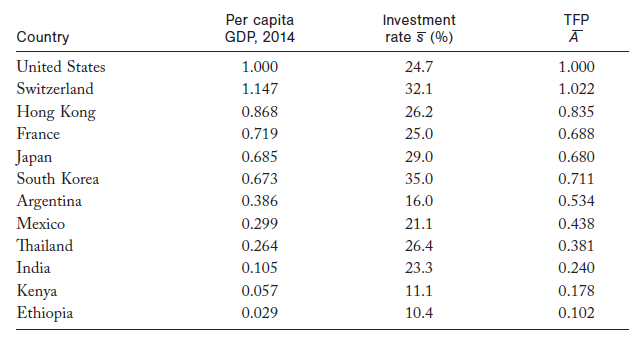
Question: Consider the data in the table below. (You may find it easier to answer these questions using a spreadsheet program.) (a) Assuming no differences in
Consider the data in the table below.
 (You may find it easier to answer these questions using a spreadsheet program.)
(a) Assuming no differences in TFP (ignore the last column) or the rate of depreciation across countries, use the data in the table to predict the ratio of per capita GDP in each country relative to that in the United States in steady state.(b) Now do the same exercise assuming TFP is given by the levels in the last column. Discuss briefly the differences you find in these two approaches.(c) Based on the numbers you find with the TFP differences, compute the percentage gap between the steady-state income ratio and the ratio in 2014(as shown in the table). Use the actual 2014 ratio in the denominator.(d) Apply the principle of transition dynamics to rank the countries in order of expected growth rate over the coming decades, from fastest to slowest.
Per capita GDP, 2014 TFP Investment rate 5 (%) Country United States 1.000 24.7 1.000 Switzerland 32.1 1.147 1.022 Hong Kong France 0.868 26.2 0.835 25.0 0.719 0.688 Japan 0.685 29.0 0.680 South Korea 0.673 35.0 0.711 Argentina 0.534 0.386 16.0 Mexico 0.299 21.1 0.438 Thailand 0.264 26.4 0.381 India 0.105 23.3 0.240 Kenya Ethiopia 0.057 11.1 0.178 0.029 10.4 0.102
Step by Step Solution
3.37 Rating (175 Votes )
There are 3 Steps involved in it
Solution Given that a The production function is not given in the given question So let us assume So... View full answer

Get step-by-step solutions from verified subject matter experts