

Draw Brians original demand curve for lattes, as you did in problem 2b. a. Use horizontal stripes
Question:
Draw Brian’s original demand curve for lattes, as you did in problem 2b.
a. Use horizontal stripes to shade the area that represents Brian’s consumer surplus when the price of lattes is $4 each.
b. Use vertical stripes to shade the area that represents the increase in consumer surplus when the price falls from $4 to $2 per latte.
Data from problem 2b
b. On a correctly labeled graph, draw Brian’s original demand curve. Then, using a different color, draw his new demand curve after the successful advertising campaign.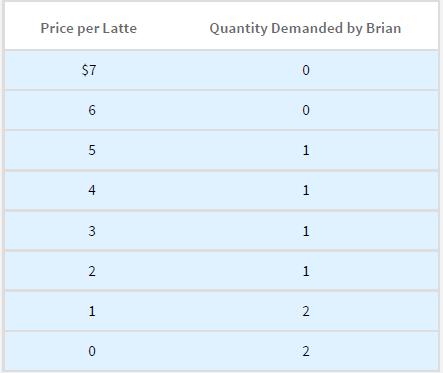
Step by Step Answer:

This question has not been answered yet.
You can Ask your question!
Related Book For 

Question Posted:
